Google Analytics reports are collections of metrics and dimensions. Simply put, metrics are quantitative measurements of data, and dimensions are attributes of that data – something that helps describe the data. Metrics are usually numeric in nature, and dimensions are typically text-based. For example, Views (metric) gives the count of the times a webpage or an app screen was seen, but Page URL (dimension) is the actual page that was seen.
Following are some key metrics and dimensions in Google Analytics to know.
Metrics
Users
Users are akin to website visitors. Each unique visitor to the website is tagged with a user ID. Google Analytics is able to track the same user IDs across multiple website visits, devices and app.
New users
The number of people who have never visited your site or app before in the specified date range.
Views
The number of times a webpage or app screen was viewed. This metric counts duplicate views from a single user.
Sessions
Comparable to a website visit, a session is a period of any activity on your website. This includes pageviews, clicks, scrolls, conversions, etc. A single website session can include multiple pageviews and conversion events.
Engaged sessions
A session that lasts longer than 10 seconds, has a conversion event, or has at least two pageviews or screenviews.
Engagement rate
The percentage of sessions that count as “engaged sessions” based on the definition above. Engagement rate = (Engaged sessions)/(Total sessions).
Conversions
Conversions reflect the number of user actions taken on your website. Conversions can vary based on your website type and business goals. These could include button clicks, subscribing to a newsletter, registering for an event, scrolls etc.
As mentioned above, dimensions add meaning to the metrics. Following are dimensions that you probably come across in a lot of reports.
Dimensions
Page URL
The URL of the webpage where an activity took place.
Landing Page
The page path (+query string) associated with the first pageview in a session.
Device category
The type of device user activity originated from (mobile, desktop, tablet, etc.)
First user source/medium
The first user source is the website or social platform that first acquired the user.
The first user medium is the marketing channel that first acquired the user. This metric can help identify the most effective channels for attracting new visitors.
You can set your own, identifiable source and mediums by using UTM parameters.
Country/Region
Geographical location of the website visitor.
Now let’s have a look at some common reports found in Google Analytics:
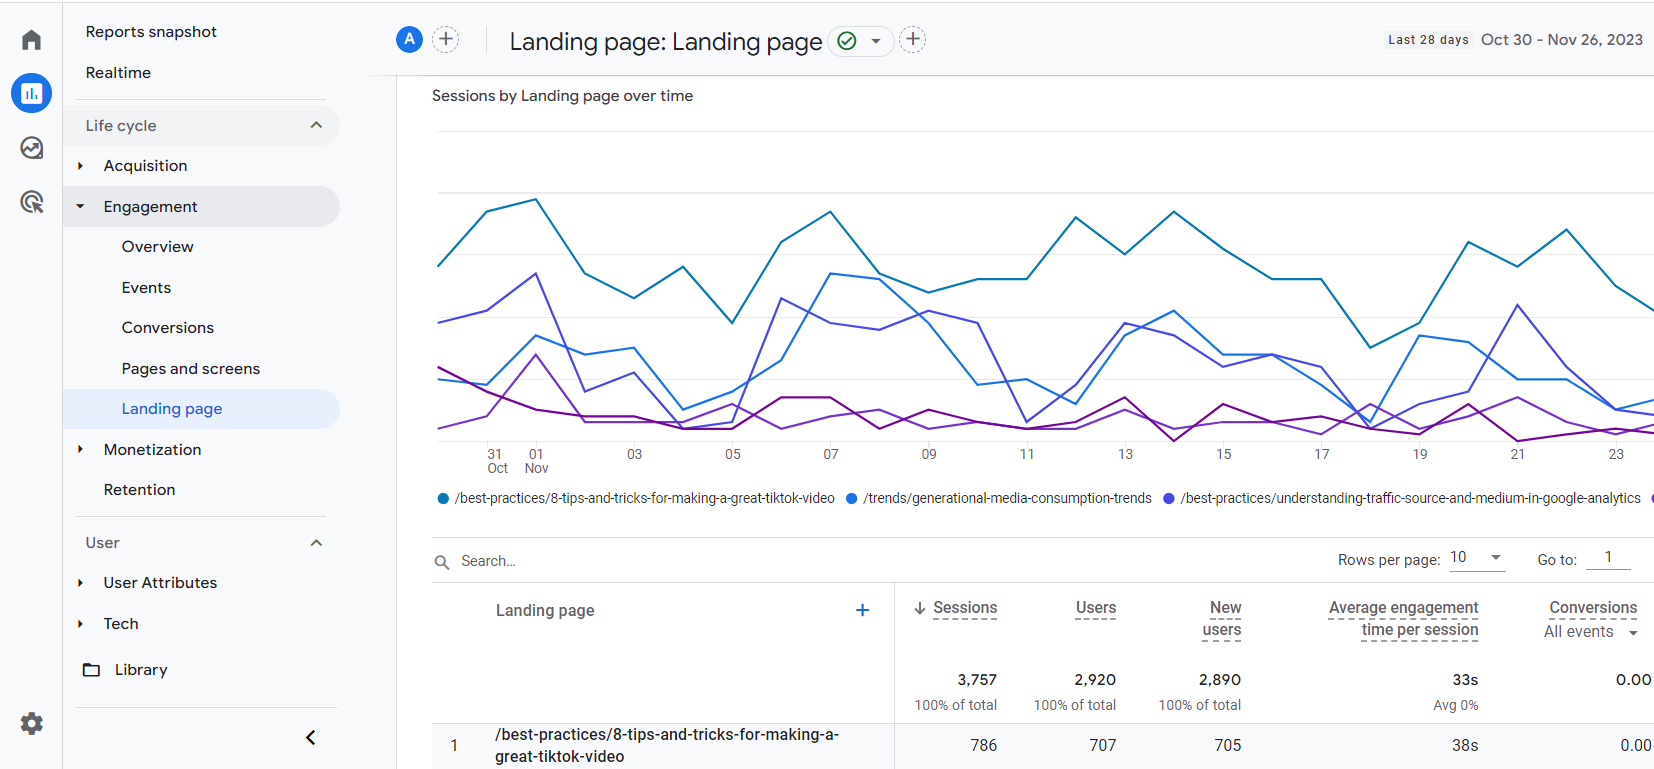
Landing page report
Shows the first pages your website visitors see on your site.
You can view the Landing Page report by navigating to the left panel in Google Analytics and finding Reports -> Engagement -> Landing Page
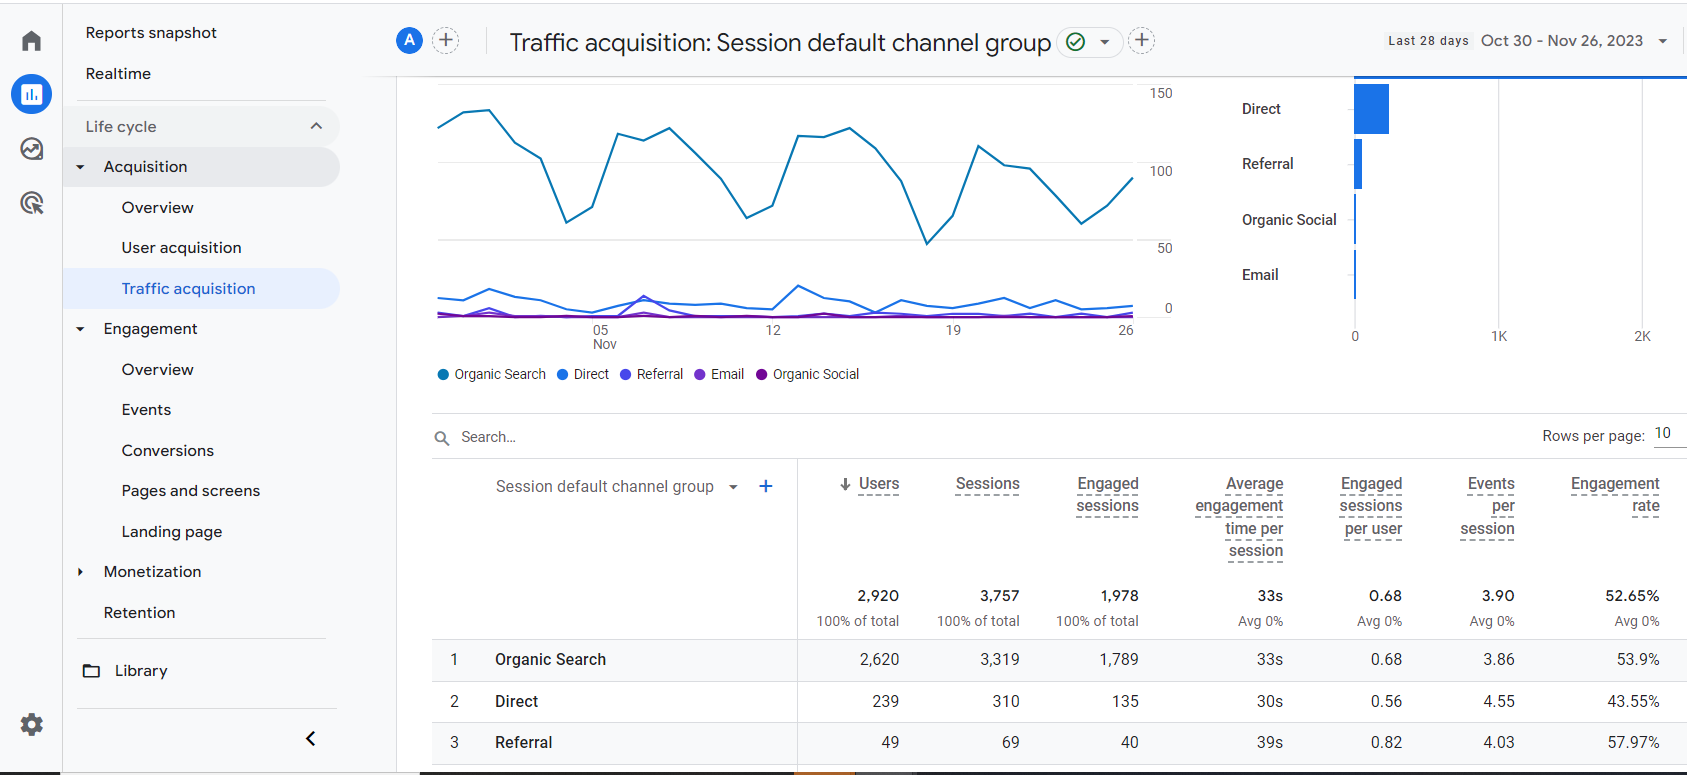
Traffic acquisition report
Identifies where users come from and how they interact with your website.
Realtime report
Shows what users are doing on your website, including visitors, traffic sources, pages and screens visited during the previous 30 minutes.

Conversions report
Shows which channels, campaigns, devices etc. drive most conversions. A number of pre-defined events can be marked as conversions. These events include:
• clicks.
• page_view.
• scroll.
• session_start.
• submit_form.
• view_search_results.
You can mark any of the above events as conversions by navigating to Admin (the gear icon on the left panel) -> Data Display -> Events.
Once you have the list of default events, you can mark them as conversions using the toggle button based on what’s important for your web marketing performance goals.

In addition, you can set up your own events to track conversions such as button clicks. In such a scenario, it is recommended to create a custom event tag using Google Tag Manager.
You can find additional resources on analytics on the Social blog. If you are affiliated with CSU, please feel free to reach out with your analytics questions.