Update: As of October 2023, GA4 offers a default Landing Page report. You can find it at Reports -> Engagement -> Landing Page. You can still use this blog post to create a custom Landing Page report within “Explore” to know your most popular webpages.
One of the most sought-after reports in Google Analytics has been the Landing Pages report. Marketers, analysts and SEOs have been so used to navigating to this report to learn which pages on the website have earned the most traffic. In conjunction with certain secondary dimensions one could also learn what the source and medium of your traffic was, which made it even more popular.
However, the landing page report in the new instance of Google Analytics (GA4) is not available by default. GA4 does provide a standard ‘Pages and Screens’ report, but it aggregates the total number of page views, irrespective of whether or not they were the first pages of a session. In this blog post we’ll go over the steps to re-create the Landing Page report that we are so used to in the older version of Google Analytics.
Exploration report for Landing Pages
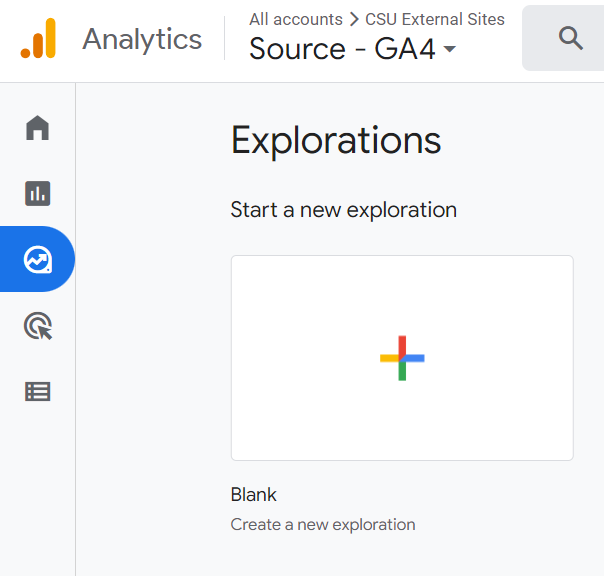
Step 1: Navigate to the ‘Explore’ section. Click on the ‘Blank’ template to start a new report:
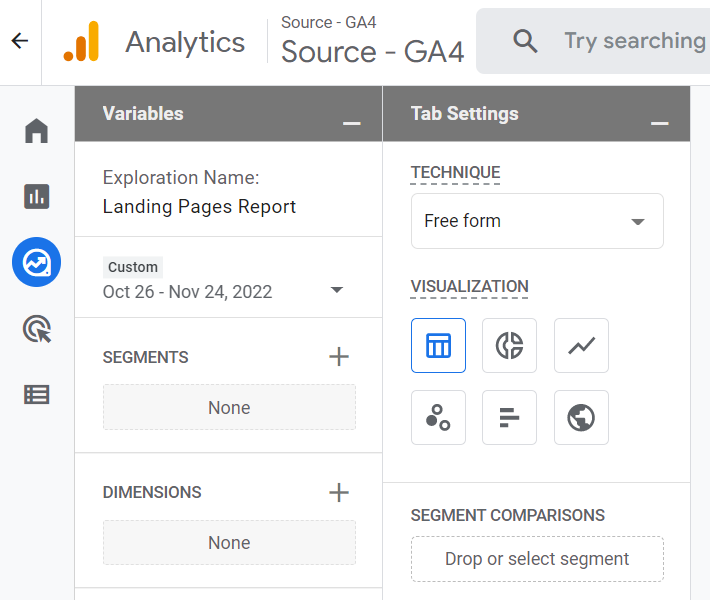
Step 2: Rename your report to “Landing Pages Report” or an appropriate name of your choice.
Step 3: Add Dimensions and Metrics.
Dimension is an attribute of your data – something that defines or adds meaning to data. For the purpose of this report you can choose from the following dimensions:
Landing Page, Page Path and Query String, Landing Page and Query String

Click the + button on the page to choose your dimensions. Once you’ve selected one of the dimensions above, click ‘Import.’
A Metric is a numerical representation of your data. It could be an average, a ratio, a percentage, etc. For the purpose of this report, you can choose the following metrics:
Entrances – Number of times that the first event was recorded for a particular session on a web page or screen.
Views – Number of web pages or app screens that users saw.
Views per user
Total users – Total number of unique users who logged an event on your website (an event can be a page view, click on a button, scroll, etc.).
Sessions – The number of sessions that began on your website or app.
Engaged sessions – This is a new metric available in GA4. It is defined as the number of sessions lasting longer than 10 seconds or had two or more page views.
Engagement rate – Engaged sessions divided by Sessions.
Once you’ve selected all of the metrics above, click ‘Import.’
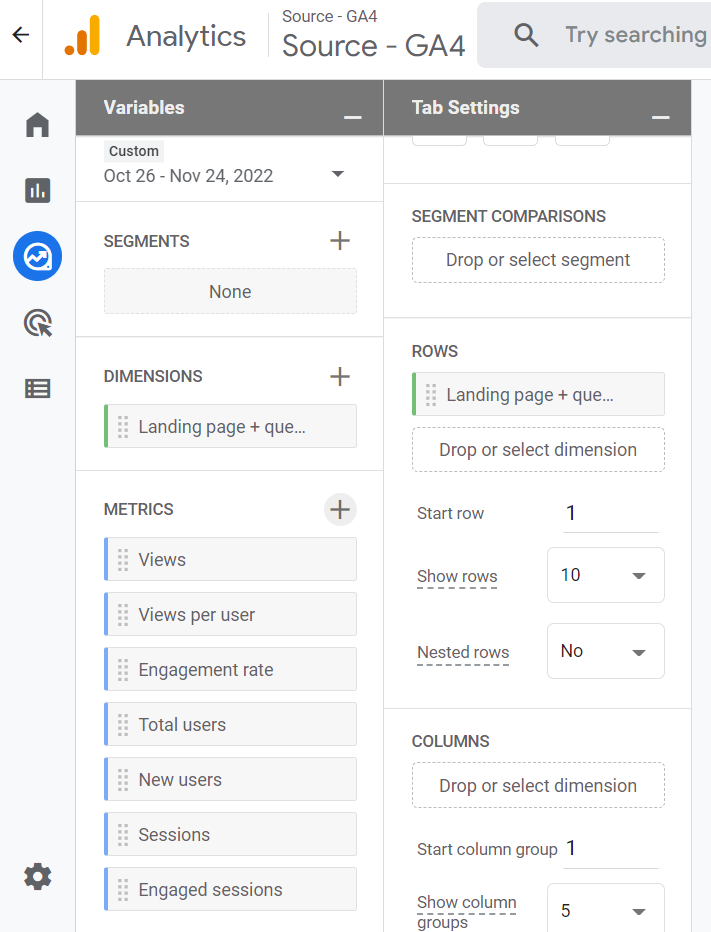
Step 4: Double click all your chosen metrics and dimensions.
This will populate the table ‘rows’ with your dimension and ‘values’ with your metrics.
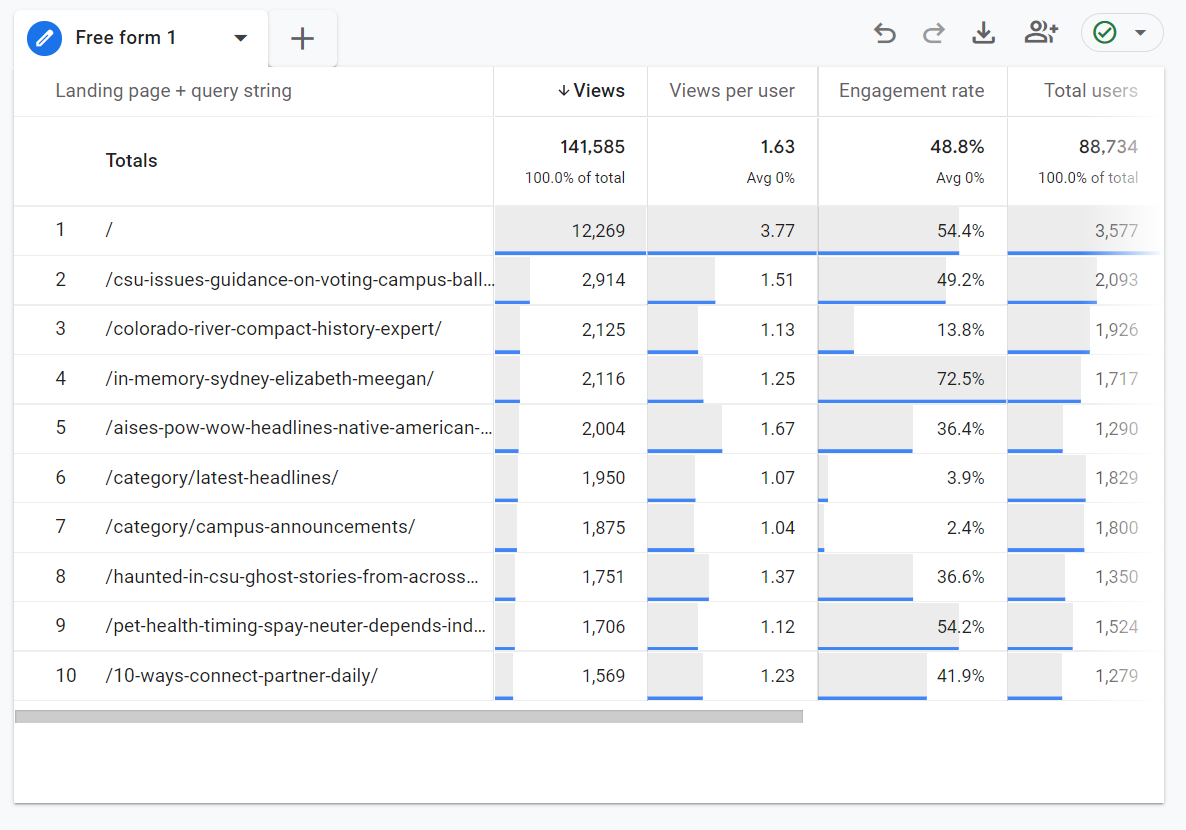
You should now be able to view a basic landing page report with your chosen metrics:
Note: The latest version of Google Analytics (GA4) will become the standard analytics instance for all web properties beginning July 1, 2023. The older version (Universal Analytics) will stop processing new data. If you haven’t done so already, you should prepare to switch to GA4.