Google Analytics is a powerful tool that can help you track and understand how visitors interact with your website. The current version of Google Analytics (GA4) comes packed with a lot of cool features, but the interface can be confusing. A frequently asked question I hear from the campus community is about finding the most popular and most engaging content on their website. You can find your most popular pages in the Landing Page report. In this post, we’ll focus on finding the most engaging content.
Finding the most engaging pages on a website
Log in to your Google Analytics property. Navigate to the Engagement report: In the left-hand menu, click on “Reports,” then select “Engagement” under the “Overview” section. This report provides insights into user engagement on your website.

Engagement on a website or webpage is defined similarly to traditional Google Analytics, but with a focus on user-centered metrics that reflect interactions and behaviors. Here are the key engagement metrics defined in GA4.
Average engagement time
Average engagement time shows the average time that your website was in focus in a user’s browser, or a mobile app was in the foreground on a user’s device. Google Analytics uses the following formula to calculate the average engagement time:
Average engagement time = (The total length of time your website was in focus or your app was in the foreground across all sessions) / (The total number of active users)
“Active users” (or just “Users”) are the number of people who engaged with your website in the specified date range.
Engaged session
An engaged session is any session that lasted 10 seconds or longer, or had 1 or more conversion events (now renamed as “key events”) or 2 or more pageviews.
Engaged session per user
Average session count per active user for the time period selected.
Engagement rate
The percentage of engaged sessions (Engaged sessions divided by Sessions).
Views per user
Within the Engagement report, you can find various metrics related to user engagement, such as active users, engagement rate, average engagement time and more. You can adjust the date range and other filters to analyze different time periods and segments of your audience.
To specifically analyze the engagement on your webpages, you can navigate to the “Pages and screens” section within the Engagement report. Here, you’ll see a list of your website’s pages ranked by views, along with their engagement metrics, such as average engagement time, number of engaged sessions, etc. You can sort the report by “Engaged sessions” by clicking on the little arrow that appears when you hover over a metric. Review the data to identify which pages or pieces of content are the most engaging for your audience.

If you don’t see these metrics displayed in the report by default, you can add them to your report by navigating to the “Customize report ”(pencil icon on the top right) and selecting the metrics from the “Metrics” drop down that you’d like to add.
Pay attention to metrics like average engagement time and engagement rate. I do recommend exporting the data in a spreadsheet to make for meaningful analyses.
Tracking Video Engagement with Google Analytics
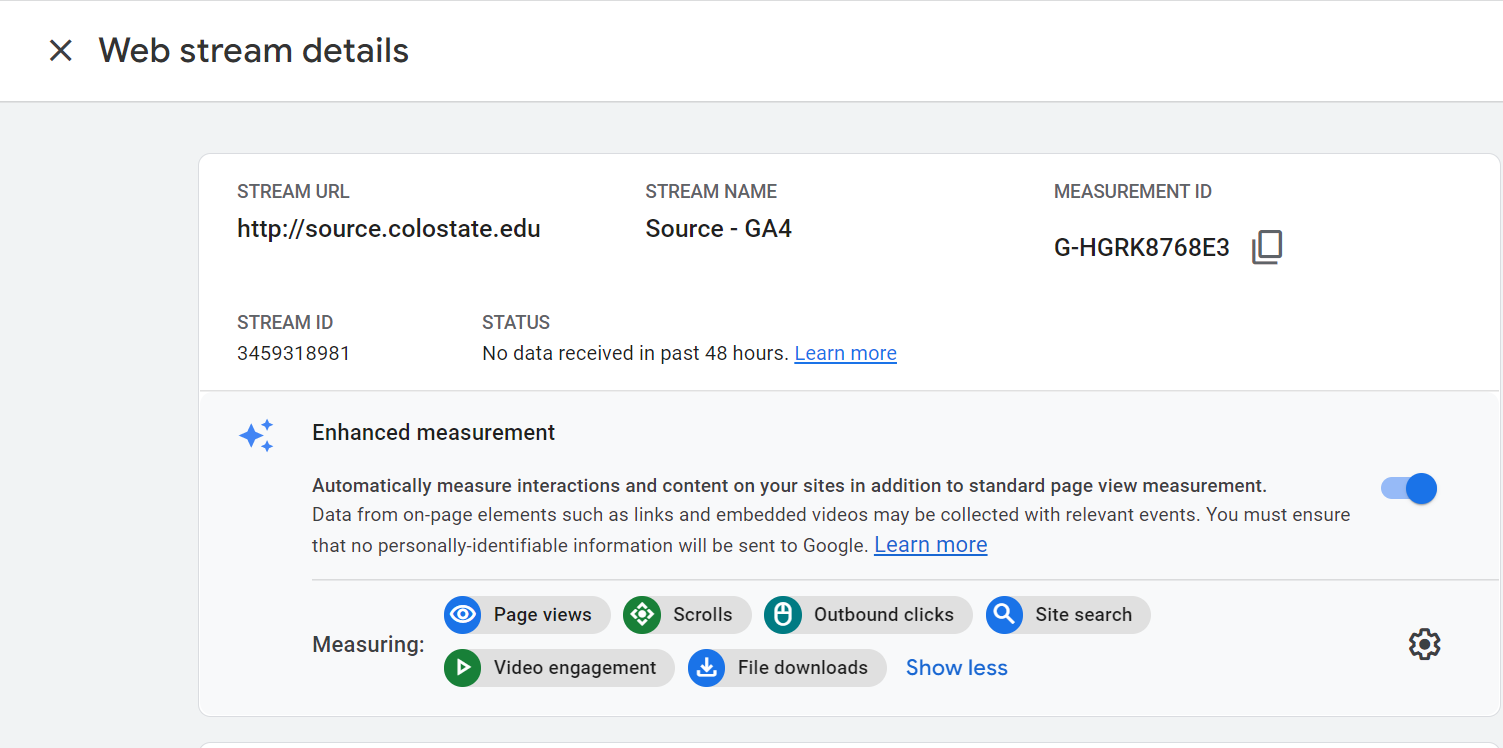
Unlike the old Google Analytics, you do not have to set up additional backend coding to track video content engagement. This is available by default with the “Enhanced measurement” module in GA4. This is where you can ensure that it is turned on for your property: Admin (the gear icon) -> Data streams -> Web -> Click into the listed property.
Once you determine that this feature is turned on, navigate to the “Reports” section located on the left-hand side of your GA4 dashboard. Click on “Engagement.” Within the Engagement section, you’ll find an option labeled “Events.” In the Event reporting section, you’ll discover a range of events that GA4 automatically tracks for video engagement, such as “video start,” “video_complete” and “video_progress.”
Build a Video Engagement Report in GA4
You can also build an “Explore” report to track video engagement.
- Select the “Explore” tab from the left panel. Give the report a title.
- Select metrics and dimensions to be displayed in the report. Choose “Video title,” “Video URL” and “Event name” as dimensions. Choose “Event count” as a metric.
- Drag and drop:
- “Event name” under Columns.
- “Video title” and “Video URL” under Rows.
- “Event count” under Values.
- Set a Filter – “Event name” contains “video.”
- Hit Apply.

Note that by default, this report will only track engagement on embedded YouTube videos. For all other platforms you would have to do additional work using Google Tag Manager.
This report should display the most-watched and completed videos on your website. By examining this report, you can gain valuable insights into how users are interacting with the videos on your website or app.