I thought I understood Facebook Reach.
To me, it was as simple as this: The number of people who have seen your content.
I was wrong.
While that statement rings true in essence, it’s also much too simplistic. Reach has layers.
The “content” in that statement could refer to “Page Posts” or to “any content associated with your Page.” The number of people you reach is going to depend on certain variables — the timeframe, or whether the reach is viral, organic, or paid.
This past month, I’ve spent a lot less time in the Adobe Creative Suite and a lot more time in Google Sheets digging around in rows and columns. I’ve learned that reach is far more complex than I realized and is often misunderstood. So here is four myths about Facebook Reach, debunked.
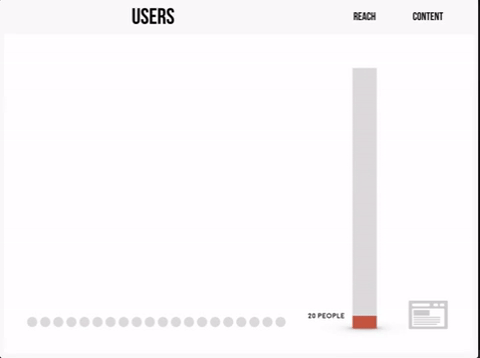
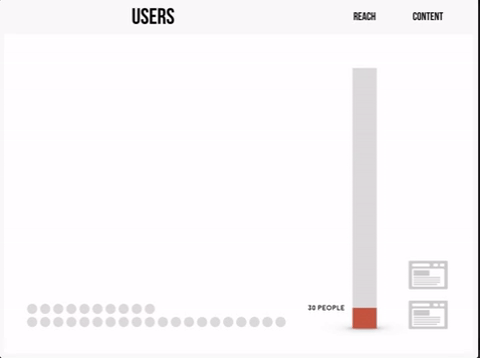
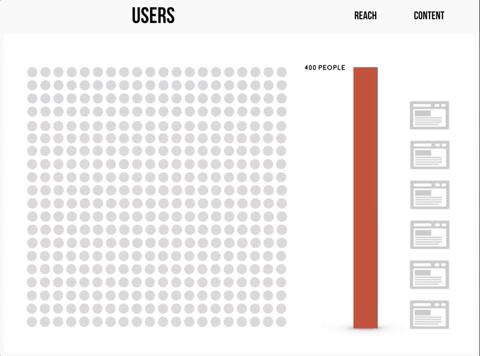
1. Adding the Unique Reach of Each Post Over the Span of a Week = Weekly Total Reach
Not so fast. There’s one little word that makes this statement untrue. “Unique.”
I mocked up a sequence of animations to illustrate what this means.


 Up until recently, I thought the Facebook Insights Panel was inaccurate. My colleagues and I were frustrated that the reach in this segment was always considerably lower than the total sum of reach for all posts within that same timeframe (e.g., Nov. 5 – Nov. 11) I blamed this on Facebook, but the real wrongdoing fell upon me. As it turns out, I was looking at the data entirely wrong and finally found the answer in Column AK of the Page Data export, which displays weekly reach indicating the unique number of people who saw any of your Page posts.
When you view a single post’s reach, Facebook is telling you the unique reach for the lifetime of that post. Adding the reach of two separate posts isn’t the correct way to determine unique reach because it’s possible — and very likely — that some users overlap. When your timeframe is the span of a week, you have to eliminate these overlaps and determine how many people were exposed to your content despite how many times they saw it.
2. You Can Determine Unique Reach for a Reporting Period Longer Than One Month
Facebook only provides unique reach data in three different intervals: daily, weekly, or 28 days. I create monthly reports, so I use the 28-day metrics (e.g., for the month of December, using the value for December 31 would give you the reach from December 4 – December 31 but would lack data from December 1 – December 3).
The bad? You’re not recording exact reach for the entire month. You’re missing a few days.
The good? You’re doing all you can do, because there’s no way of determining reach for a period longer than 28 days. The bright side is that this provides a uniform method for recording data.
With the data we’re given, we cannot provide total unique reach for yearly, bi-annual, or even quarterly reports. We can compare increments of 28 days in bar chart fashion if we’re curious which interval generated the most unique reach, but we simply cannot know how many unique users our Page reached over the span of any timeframe 29 days or longer.
3. All Reach is the Same
First things first, let’s differentiate two categories of reach: Page Reach vs. Post Reach.
Page reach always gives you the number of people who viewed any content associated with your page. This not only includes users that viewed your posts but also users that viewed e.g. a photo album or users that saw any stories about your page in their news feeds. Other than that, the page reach also includes users who have been reached by your ads (so called dark posts).
Post reach describes the number of people who saw a certain post of your page. So for every post a page posted, you can see the number of people you reached.
Facebook Reach can be broken down even further.
Total Reach: The number of unique people who have seen any content associated with your page.
Paid Reach: The number of people who saw a sponsored story or ad pointing to your page.
Organic Reach: The number of people, according to the Facebook API, who visited or saw your page or one of your posts in the news feed or ticker.
Viral Reach: The number of people, according to the Facebook API, who saw your page or one of your posts from a story shared by a friend.
Note: A user can be present in both the organic reach and viral reach numbers, so the sum of the two will not necessarily equal the “total reach.”
Examining viral and organic reach has yielded a couple different interesting insights.


Above, we see a breakdown of reach distribution for a one-month period. The domination of viral reach is not atypical, as I noticed that a majority of reach being attributed to viral engagement was a recurring theme. This is exciting, because it reaffirms our mission to create engagement-driven content. When Facebook defines viral reach as the number of people who saw your page or one of your posts from a story shared by a friend, this is what it means. A “story” is essentially an update from a friend about their engagement with a page, another user, an event, etc. that appears in News Feed. Let’s take a look at Figure 8. This post reached my News Feed simply because of an engagement by someone on my friend list. As engagement on your post builds, so will reach, because the post will be placed into the News Feeds of users who have not already liked your page. This is the power of viral reach.
Our rockstar intern, Michael Quinn, noticed another interesting finding. Our new top Facebook post of all time has reached more than 18 million users. The next best post reached around 5 million. But in comparing the two, the post with a reach of 5 million had a significantly larger amount of organic reach than the post that reached 18 million. These findings help inform our strategy when trying to reach users outside our immediate network of followers.
4. Reach Matters, Impressions Don’t
When I realized the mistake of calculating the reach for every single post in a week and using the sum as Weekly Total Reach, it occurred to me that we were basically attempting to calculate impressions, not reach. For me, impressions can be a difficult number to grasp because 1) it tends to be a very large number and 2) it simply indicates that a post from your page has been displayed on a user’s News Feed, whether the post was consumed or not. Yet I’m a firm believer in the value of impressions, mostly because of a book I read by Jonah Berger. I see reach as a horizontal measurement of your brand’s success. It’s about breadth. Is your content reaching a vast range of people outside your immediate network of followers? Because that’s important. More reach means more audience. More audience often leads to more followers. But what about the vertical measurement — the frequency with which your content is being seen? That matters, too. In Jonah Berger’s chapter on Triggers, he stresses the value of frequent triggering to make people think about your product or idea — in our case, the Colorado State brand. Top-of-mind means tip-of-tongue. The more impressions we generate, the more our brand becomes top-of-mind and, potentially, tip-of-tongue — the front door to the wonderful land of word-of-mouth. If we can use triggers to place the CSU brand atop the mind of a prospective student, the odds of becoming this student’s number one school of choice becomes greater.

Reach is complicated, and I’m still learning. If you have questions or if I got something wrong here, send me a tweet @chase_baker and let’s talk about analytics!